


Manufacturers and logistics operators are pressured to improve efficiency without expanding physical capacity. Margins shrink with every hour of downtime, every unplanned route deviation, every manual decision made too late.
A digital twin transforms operational data into a living, computational model of the warehouse or production line. It predicts, tests, and optimizes performance in real time. More importantly, it provides decision support that can be acted on immediately, before delays or losses accumulate. According to McKinsey, 86% of industrial executives consider digital twins applicable to their organization, and nearly half have already implemented one. If you are still not in this list, Acropolium can help you move from concept to measurable results - talk to us.
Let’s start with discovering what is digital twins in manufacturing and how they work.
What are digital twins in manufacturing: warehouse and production line?
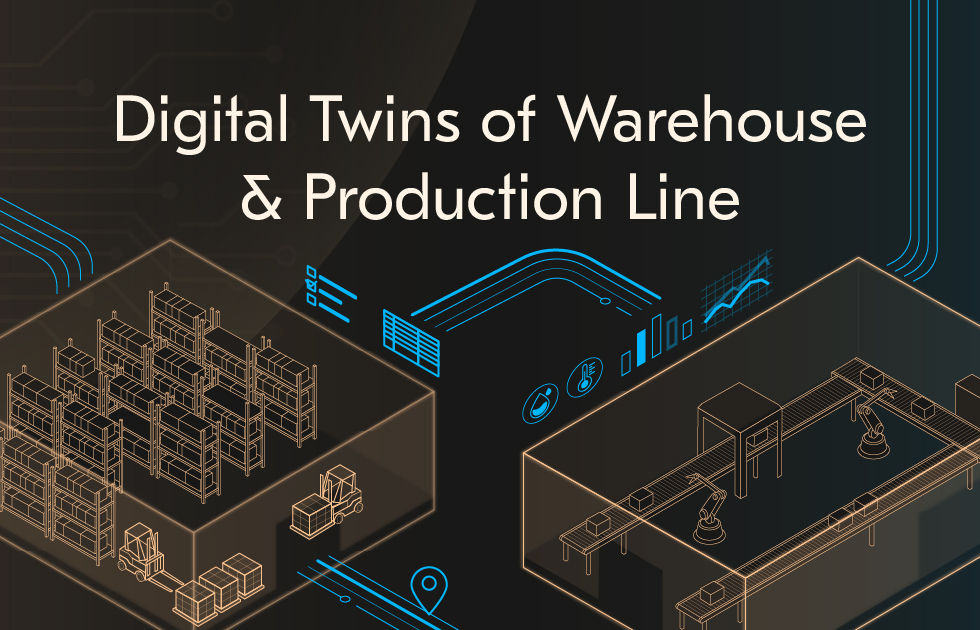
A digital twin for a warehouse or production line is a dynamic, data-driven model that continuously mirrors the behavior of physical operations. It unifies real-time telemetry, simulation, and decision logic into a single analytical environment capable of predicting outcomes, optimizing performance, and supporting operational decisions with measurable precision.
How do digital twins work in manufacturing?
A fully developed digital twin operates across several interconnected layers forming its analytical and operational architecture. 
2. Above this foundation sits the logical and behavioral layer, where operational intelligence resides. Here, the twin encodes process constraints, routing logic, business rules, and safety standards that govern systems’ behavior under varying conditions.
3. The simulation and optimization layer transforms static modeling into active decision support. Using historical data and live telemetry, this layer executes scenario-based simulations to forecast system behavior, testing alternative configurations, scheduling rules, or automation strategies without interrupting operations.
4. Finally, the integration layer connects the twin to enterprise software ecosystems, enabling seamless data exchange across operational and strategic systems. Manufacturing execution systems (MES) supply real-time production data, while warehouse management systems (WMS) contribute inventory positions and movement histories.
What are the core performance metrics for a digital twin in manufacturing?
The analytical granularity of digital twins in manufacturing market depends on how it defines and measures a unit of work; the smallest meaningful activity in the system. In a warehouse environment, work units typically revolve around picking, pallet movement, and order line processing. The digital twin warehouse models these as discrete, measurable events characterized by time, distance, and resource utilization.
In production environments, the unit of work often corresponds to a manufactured part or batch, traced through every stage of the process. The digital twin monitors cycle times, material transitions, and changeovers, providing insight into equipment performance, quality variation, and yield.
Why is process modeling important in digital twins in manufacturing?
Process modeling is the analytical core of a digital twin. It converts operational data into executable logic that mirrors the behavior of a physical system under real-world constraints.
How to choose the right modeling approach: discrete-event vs agent-based simulation
Digital twins use simulation to capture the structure and dynamics of real-world operations. Discrete-event simulation models processes as a sequence of time-stamped events, each triggering a change in system state. It is particularly effective for systems governed by queuing, flow, or capacity constraints.
On the other hand, agent-based modeling focuses on autonomous decision-making entities that interact within defined rules and environments. It is used when system dynamics emerge from many independent actions rather than a linear process flow. In warehouse twins, agent-based models simulate worker behavior, robot navigation, or congestion dynamics. While in manufacturing, they help analyze machine coordination or multi-robot task allocation.
How to ensure model credibility and accuracy
The analytical strength of a digital twin depends on the accuracy with which its model reproduces the physical system. Calibration and validation work on outputs of every simulation to reflect empirical truth.
Model calibration begins with aligning digital parameters to measured performance data, cycle times, travel paths, or machine throughput. Historical data is replayed within the simulation to verify that the model reproduces known outcomes. At the same time, validation follows through Verification, Validation, and Accreditation procedures, combining statistical comparison and dynamic testing. The model must reproduce observed system behavior within defined error tolerances. Once validated, the digital twin warehouse can be a reliable analytical baseline for experimentation and optimization.
With a validated model, the digital twin becomes a strategic experimentation platform. Simulation environments can reproduce production conditions, modify parameters, and evaluate the results of alternative decisions. Scenario testing enables organizations to compare multiple process configurations, layout options, or scheduling rules without interrupting operations.
How to build a data infrastructure for a digital twin
Digital twin performance depends on the precision, continuity, and interpretability. Behind every real-time simulation lies an interconnected network of sensors, control systems, and enterprise applications that feed the model with structured and unstructured data.
Integrated data ecosystem
A production-grade digital twin warehouse aggregates information from industrial control systems, enterprise applications, and embedded sensors. Its effectiveness depends on the interoperability between these layers. Industrial IoT and sensor layer provide continuous measurements from machines, vehicles, and environmental systems. Operational technology integration layer consolidates data from control and supervisory systems:
PLCs and SCADA: Provide the execution logic and real-time operational feedback from production lines, packaging systems, or conveyor belts.
Open platform communications unified architecture: The primary protocol standardizes secure, vendor-agnostic data exchange between PLCs, sensors, and higher-level systems.
Real-time location systems: Capture spatial data for moving assets, forklifts, or AGVs, enriching the twin with continuous positioning information.
In enterprise systems, digital twins extend beyond the factory floor, requiring integration with business and logistics systems (ERP, MES, WMS, etc.) to contextualize operations. Complementing live telemetry are archived datasets that refine prediction models and validation. Combining empirical sensor data with rule-based expert input allows the twin to move beyond replication and into optimization and decision support.
Acropolium’s experience developing AI-powered asset monitoring systems demonstrates how real-time telemetry, edge processing, and predictive modeling translate into reliable, scalable digital-twin architectures across industries.
Data pipeline design
The performance of a digital twin depends as much on its data infrastructure as on its algorithms. Once telemetry sources are connected, the entire system’s efficiency is determined by how data is ingested, synchronized, validated, and stored. A digital twin’s synchronization layer operates on a balance between immediacy and precision. High-frequency telemetry, such as machine vibration or torque data, may require millisecond-level updates. In contrast, warehouse positional or event-based data can be processed in multi-second intervals.
The accuracy of the twins’ analytics depends directly on the quality and structure of the data feeding it. Automated validation processes reconcile inconsistent units, correct timestamp drift, and remove outliers before they propagate into the model.
What are the project economics and payback modeling for digital twin implementation?
Every digital twin warehouse initiative must begin with a verified financial foundation. Beyond its technological sophistication, the project’s success depends on how accurately the organization models its total cost of ownership (TCO), forecasts operational efficiency gains, and determines the payback horizon.
A well-structured financial model aligns three elements: the TCO framework, which quantifies investment and risk; the OEE-based performance model, which measures operational returns; and a clear ROI tracking system, which validates payback against baseline performance data.
TCO model

OEE-driven value model

A robust economic assessment quantifies how each operational lever contributes to ROI:
Availability: Reduced unplanned downtime through predictive maintenance and anomaly detection.
Performance: Increased throughput via flow optimization, balanced line utilization, and improved scheduling.
Quality: Lower defect rates through real-time quality monitoring and process standardization.
Efficiency: Shorter cycle times, faster changeovers, and optimized material flow across production and warehouse environments.
Logistics productivity: Enhanced pick rates, dock-to-stock speed, and WIP visibility for consistent order fulfillment.
These gains extend beyond the production floor. In logistics and warehousing, the same modeling principles improve pick rate, dock-to-stock cycle time, and work-in-progress visibility. These three dimensions, availability, performance, and quality, together define OEE = Availability × Performance × Quality
How to structure the 12-month economic model
For most organizations, the first year of a digital twin warehouse program defines confidence and trajectory. A structured 12-month view separates initial CapEx from recurring OpEx, showing how savings accumulate as the system stabilizes.
The payback period, typically between six and twelve months for well-scoped projects, is calculated as follows: payback = Initial outlay / monthly net benefit. This rolling analysis should remain a living financial model, updated quarterly with actual performance data to validate assumptions, refine forecasts, and support reinvestment decisions.
Practical examples of digital twins in the warehouse and production line
Route optimization
A digital twin warehouse integrates live data from WMS, OMS, and real-time location systems to simulate picker behavior across route and order configurations. After validation, this approach reduces walking distance, improves task density, and stabilizes picking performance during peak demand. The immediate outcomes are shorter fulfillment cycles, balanced labor distribution, and measurable improvement in utilization of each picker-hour.
These results can be expressed financially as a Cost per Task (CPT) metric, calculated as: CPT = TCO / tasks per period, where “tasks” correspond to picks, pallet moves, or order lines processed.
Slotting and inventory positioning
Beyond routing, digital twins enable continuous slotting optimization. They simulate how product velocity, order mix, and replenishment frequency affect handling time and congestion. The same model can test future expansion options or changes in product mix, allowing decision-makers to evaluate outcomes before committing capital. In one deployment, layout and process adjustments validated through the digital twins in manufacturing automation eliminated the need for a new facility.
Bottleneck identification
Once the bottleneck is located, the twin simulates corrective actions and calculates their downstream impact. This predictive validation allows the factory to execute only those interventions that deliver measurable cycle-time improvement. The same methodology is applied to layout planning and virtual commissioning, shortening ramp-up periods for new production lines and minimizing disruption during reconfiguration. When process reconfiguration increases the system’s output rate, the improvement is quantified as:
Throughput gain = New throughput − baseline throughput
Predictive maintenance
By connecting sensor networks and control systems to the twin, maintenance teams gain a continuously updated model of equipment behavior. Predictive algorithms analyze vibration, temperature, or current data to forecast degradation and recommend optimal service intervals. This replaces fixed schedules with condition-based maintenance, preventing unexpected failures and aligning service windows with production demand.
How to manage sensitivities and compressing time-to-value in digital twin projects
The strength of digital twins in manufacturing companies depends on the accuracy and completeness of its data. Weak or inconsistent data inputs reduce the model’s fidelity and limit its ability to optimize real-world operations. Before scaling, ensure data is characterized by type, quality, precision, and reliability. Without validation, optimization results risk being misleading.
Upfront costs for sensors, integration, and simulation platforms can delay ROI if implementation is not phased strategically. Managing this sensitivity requires a clear CapEx/OpEx plan, realistic payback modeling, and prioritization of quick-win use cases. Digital twin ROI should be modeled across three performance scenarios to forecast realistic financial outcomes.
Conservative scenario: 5–10% cost reduction, 10–20% efficiency improvement, ROI within 12–18 months.
Base scenario: 15–20% cost savings, 25–30% throughput improvement, ROI within 6–12 months.
Upside scenario: 25–30% operational cost reduction, 40–50% time-to-market improvement, payback under six months for well-instrumented systems.
Sensitivity modeling helps quantify uncertainty and stress-test assumptions. Varying core parameters such as ±10 percentage points in utilization, ±15 pp in staff availability, or ±20% in demand variability provides a range for expected ROI and ensures resilience under changing operational conditions.
How to accelerate time-to-value
Time-to-value measures how long it takes before a digital twin begins generating quantifiable returns. Start with use cases that already have reliable telemetry and visible inefficiencies. For example, picker route optimization, line balancing, or predictive maintenance. Instead of deploying an end-to-end twin at once, build incrementally.
Accelerated value realization depends on standardized, transparent data. Implement data harmonization across IoT, MES, and ERP layers to eliminate redundancy and bias. Use dashboards and visual process maps to make the twins’ decision logic visible, building organizational confidence and enabling faster adoption by operations teams. Teams can begin with historical datasets to test process logic and gradually layer in live telemetry.
How to calculate ROI for your shop/warehouse checklist and mini calculator

Step 1. Establish the ROI framework
The foundational equation for return on investment is straightforward: ROI = (Benefits − TCO) / TCO. What matters is the accuracy of inputs, Total Cost (I) and Returns, over a realistic time horizon. For digital twins, this is typically 12 to 36 months, as savings and optimization gains compound after the initial modeling and calibration phase.
Step 2. Define and quantify the investment
The investment profile of a digital twin includes upfront and ongoing components. Each must be itemized to reflect the true total cost of ownership.
Hardware and infrastructure: Sensors, controllers, and edge devices for telemetry acquisition; networking upgrades; and, if applicable, cloud or hybrid compute resources.
Automation and equipment: Additional integration with AGVs, conveyors, or automated storage systems.
Software licensing: Costs of digital twin and simulation platforms, analytics engines, visualization tools, and predictive maintenance modules.
Integration and customization: Effort to connect legacy WMS, ERP, MES, and PLC systems.
Talent and consulting: Internal staff time for data engineering and modeling and external expert support for simulation calibration and validation.
Data management: Ongoing expenses for cleaning, labeling, and managing telemetry streams.
Step 3. Define and quantify the returns
The financial benefits of digital twins in manufacturing typically emerge across four measurable dimensions: cost reduction, efficiency gain, quality improvement, and revenue uplift.
Operational and cost reduction gains
Labor efficiency: Optimized routes and load balancing can cut manual labor.
Downtime reduction: Predictive maintenance can reduce unplanned downtime.
Inventory and waste minimization: Accurate demand simulation can lower working capital and reduce waste or rework costs.
Energy and resource savings: Continuous monitoring and scheduling optimization improve utilization and reduce idle energy consumption.
Productivity and process optimization
Throughput improvement: Based on simulation results, line or warehouse throughput can rise after process reconfiguration.
Time-to-market reduction: Validating process changes digitally cuts implementation cycles by up to half.
Asset utilization: Enhanced visibility can push utilization rates, improving ROI on existing infrastructure without additional CapEx.
Quality and service-level enhancements
Quality rate improvement: Early anomaly detection in virtual commissioning improves product qualification rates.
Customer fulfillment accuracy: Scenario modeling helps align inventory to demand variability, improving delivery promise adherence.
Together, these factors define Total Annual Returns ®, the core of the ROI formula.
Step 4. Apply the mini ROI calculator
A simplified estimation framework can help approximate payback even before implementation.
Identify baseline costs. Establish annual figures for key operational areas such as labor, downtime, and waste.
Apply expected gains. Multiply each cost by the expected improvement percentage from comparable deployments.
Estimate total investment. Suppose total implementation and integration costs amount to $400,000.
Calculate payback and ROI:
Payback Period: $400,000 / $99,500 ≈ 4.0 years
ROI (Yearly): (99,500−400,000)/400,000×100=−75(99,500 - 400,000) / 400,000 × 100 = -75%(99,500−400,000)/400,000×100=−75** (negative in year one; turns positive after optimization)
ROI (3-year horizon): cumulative savings of $298,500 on $400,000 → ROI ≈ 74%
Real-world results vary widely, but validated projects in logistics and manufacturing often show ROI in 6–12 months when modeling is combined with route optimization, predictive maintenance, or line balancing.
Step 5. Establish financial governance
ROI calculation should not end at deployment. Maintain a rolling model that compares projected versus actual savings monthly. Recalibrate assumptions when telemetry or operational data deviates from baseline. This feedback ensures the digital twin continues to produce validated financial outcomes, not theoretical ones.
Step 6. Interpreting payback
A well-structured digital twin program rarely yields instant savings. The first stage is an investment phase. ROI accelerates once the model stabilizes and optimization scenarios translate into operational policy. Based on process criticality and risk exposure, CFOs and operations heads should align on acceptable payback thresholds.
What to check before purchasing: Procurement checklist
When preparing to invest in a digital twin production line solution, a thorough pre-procurement assessment determines whether the implementation will achieve measurable ROI or become an experimental expense. The checklist below consolidates the critical strategic, technical, financial, and organizational checkpoints.
Scope definition
The success of a digital twin begins with clarity of purpose. Procurement teams must articulate why the twin is being built, what it will represent, and how it will create a measurable impact.
Define intended use: Specify the primary outcome, like simulation, prediction, real-time control, or decision optimization.
Determine scope and granularity: Decide whether the project focuses on an asset-level twin, a process twin, or a system twin.
Prioritize high-value targets: Rank operations by downtime cost, process variability, and automation readiness.
Map the as-is process: Document every step, input, and constraint of the existing workflow before simulation begins.
Data readiness
Procurement must confirm that telemetry, storage, and interoperability foundations are in place before modeling begins.
Characterize required data: Identify operational, environmental, and event-based data sources.
Evaluate data quality and governance: Verify data accuracy, completeness, and ownership.
Ensure data homogenization: Standardize formats and semantics across IoT, WMS, MES, and ERP sources to prevent analytical bias and duplication.
Confirm interoperability with existing systems: Assess how the digital twin platform integrates with PLCs, SCADA, and enterprise applications.
Define sensor and telemetry strategy: Select appropriate sensors based on use case and environment.
Establish synchronization frequency: Determine the required data update rate.
Solution design
Procurement should treat the digital twin not as software acquisition but as systems engineering. Vendor evaluation for implementing digital twins in manufacturing must cover model architecture, validation methodology, and openness for future integration.
Require high model fidelity: The virtual model must capture geometric, temporal, and behavioral parameters to reproduce real-world performance.
Request verification and validation: Ensure the vendor applies structured validation, compares simulation output to historical data and verifies prediction accuracy.
Confirm Bi-directional data exchange: A true digital twin allows automatic synchronization between the virtual and physical systems.
Evaluate AI / ML integration: Check whether predictive analytics, anomaly detection, and optimization algorithms are natively supported or require external modules.
Verify third-party compatibility: Ensure the platform can connect to external analytics or visualization tools without vendor lock-in.
Financial, organizational, and risk assessment
Even the best technical architecture fails without financial and organizational alignment. Procurement must link investment decisions to measurable business outcomes and secure internal readiness.
Quantify total cost of ownership: Include software, sensors, integration, cloud infrastructure, and maintenance.
Address talent and skills gap: Identify expertise required in data science, industrial engineering, and automation control.
Establish change management and training programs: Define how new workflows will be adopted, documented, and supported.
Implement cybersecurity controls: Require encryption, role-based access, and regular vulnerability audits across all IIoT endpoints.
Conduct cost-benefit: Model multiple ROI scenarios accounting for variability in utilization and demand.
Checking these dimensions early: strategy, data, design, finance, and governance, shortens the path from pilot to measurable payback and ensures every modeling dollar contributes to long-term value creation.
Start with digital twin payback with measurable KPIs in 10 days of modeling
Digital twin modeling exposes hidden dynamics precisely, turning operational noise into actionable data. Within ten days of simulation and telemetry alignment, you can see where value leaks, how each constraint affects throughput, and which interventions deliver the fastest payback.
If you are planning to modernize your warehouse or production line, or need a proven way to justify automation and process investments, Acropolium can help. We have deep experience in warehouse and logistics system development. See how we built a multi-tenant cloud WMS for a 3PL operator in our SaaS warehouse management system development case study, where we achieved higher fulfillment efficiency, real-time inventory visibility, and rapid client onboarding. Uncover where your next 10% efficiency gain is hiding and how quickly it can pay back, book discovery.


![Shipping Management System Development ☑️ [2025 Guide]](/img/articles/shipping-management-system/img01.jpg)

![ᐉ Warehouse Management Systems Development [2025 Guide]](/img/articles/warehouse-management-systems/img01.jpg)
![Blockchain for Supply Chain Management: [Benefits & Use Cases]](/img/articles/why-and-how-to-employ-blockchain-in-supply-chain-management-tips-and-success-stories/img01.jpg)
![ᐉ Logistics Customer Portal Development: [2025 Guide]](/img/articles/logistics-customer-portal-development/img01.jpg)